
Spotify for Artists analytics can tell you, with reasonable certainty, whether a playlist-promotion campaign delivered real listeners or just inflated numbers. The three charts to check first: the Source of Streams chart (shows exactly which playlists drove plays), the Audience Segments tab (shows whether new listeners converted), and the Release Engagement view (tracks sustained interest over 28 days). Before anything else, glance at these:
- Source of Streams: Did streams spike from editorial/programmed playlists on the campaign date? A named playlist in this chart is your first confirmation.
- Follows and saves: A stream bump with zero follow or save lift is a red flag, not a win.
- Intonality campaigns: Ask your promoter for the curator name, public playlist link, and UTC timestamp — then cross-check all three against your dashboard.
Table of Contents
- Where are the key Spotify for Artists charts and what do they show?
- The six metrics that actually tell you if a campaign worked
- How to attribute a stream spike to a specific playlist placement
- What to do in the 72 hours after a placement goes live
- How to spot a low-quality or fake placement
- How to set benchmarks and track results across campaigns
- What should you ask your playlist promoter before paying?
- Key Takeaways
- Analytics-first promotion is the only kind worth buying
- Intonality campaigns come with proof built in
- Useful sources
Where are the key Spotify for Artists charts and what do they show?
The Analytics section of Spotify for Artists centralizes everything you need. Here is how to get there and what each view actually tells you.
- Log in at artists.spotify.com and click Music in the left nav.
- Select the song you promoted. You will land on its overview page.
- Click the Playlists tab to see every public playlist carrying your track and the stream count each one contributed.
- Go back to the song overview and check Daily streams — look for the day your campaign launched.
- Navigate to Audience → Segments to see listener-conversion metrics: new listeners, reactivated listeners, and share-of-streams per segment.
- Check Release Engagement to see how many of your monthly active listeners streamed the track each day during the first 28 days after release.
A healthy post-placement lift looks like a significant jump in daily streams on day one, paired with a visible uptick in follows and saves within 24–48 hours. The daily streams chart updates in near real-time for the first seven days, then shifts to 24–48 hour delays. One critical detail: all timestamps use UTC and cannot be changed, so always match your promoter’s report to UTC dates, not your local time.
The six metrics that actually tell you if a campaign worked
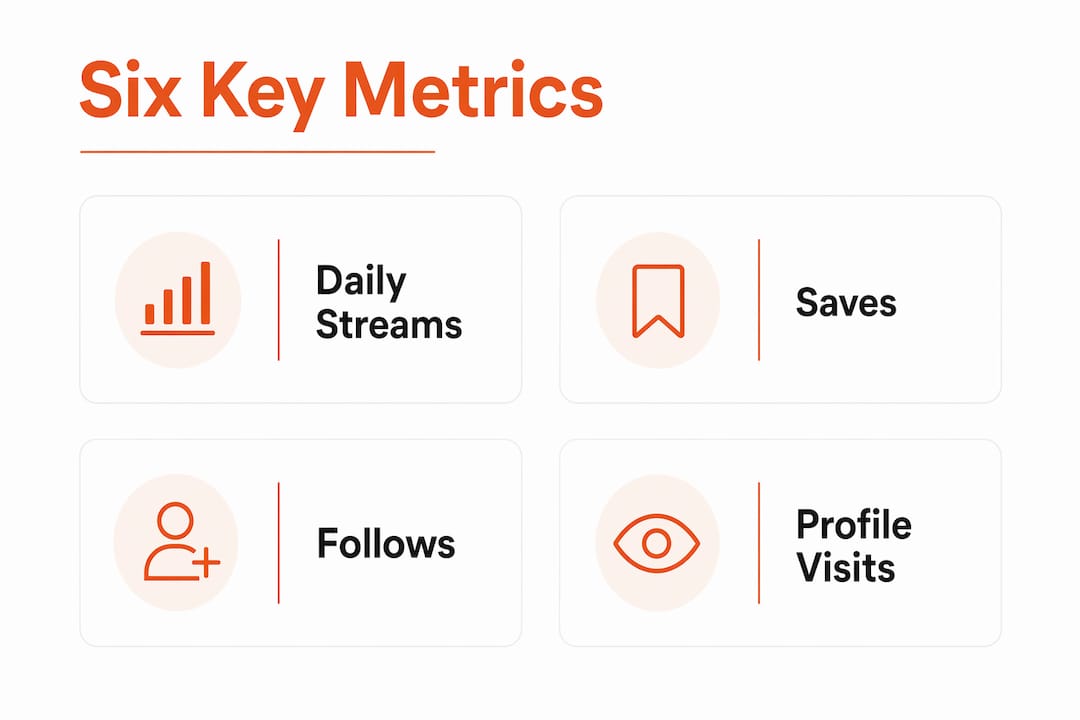
Raw stream counts are the least useful number on the dashboard. Here is what to track instead, and what each metric proves.

| Metric | What it proves | Green signal | Red flag |
|---|---|---|---|
| Daily streams | Volume of plays on campaign date | significant day-one spike | Flat or gradual — no clear date correlation |
| Unique listeners | Real people reached | Grows alongside streams | Streams up, listeners flat (bot signal) |
| Saves | Listener intent to return | noticeable increase versus pre-campaign baseline | Zero movement despite stream spike |
| Follows | Long-term fan conversion | Any measurable lift | No follow gain after 7 days |
| Profile visits | Discovery interest | Spike on placement date | Absent even with high streams |
| Streams-per-listener | Engagement depth | Above 1.0 streams per listener | Below 1.0 (one-and-done plays) |
Saves and follows carry more weight than streams for long-term growth. Spotify’s own data shows that followers stream 3x more in the six months after following an artist, and new releases reach them automatically through Release Radar and the What’s New feed. A placement that adds streams but zero followers tends to have a short lifespan, while one that adds followers continues to generate engagement for months.
The Audience Segments tab breaks your listeners into monthly active, super listeners, and programmed listeners — and shows listener-conversion metrics that link specific marketing actions to measurable shifts in your audience. Watch whether new listeners from a campaign move into the “monthly active” segment over 28 days. That movement is the real proof of a quality placement.
How to attribute a stream spike to a specific playlist placement
Attribution is where most artists get sloppy. A stream bump could come from a curator playlist, Discovery Weekly, a TikTok post, or a Reddit thread. Here is how to isolate the cause.
- Align dates in UTC. Get the exact placement date and time from your promoter in UTC. Open your daily streams chart and find that date.
- Check Source of Streams. The Source of Streams chart shows streams broken down by editorial playlists, algorithmic sources (Discovery Weekly, Radio), profile plays, and direct sources. If your bump came from a curator playlist, it will appear under editorial or programmed playlists — not under algorithmic.
- Confirm in the Playlists tab. Go to Music → your song → Playlists. The curator’s playlist name should appear here with a stream count. No playlist name? The bump came from somewhere else.
- Match the promoter’s report. Ask for the curator name, the public playlist URL, and the UTC timestamp of placement. Cross-check all three.
- Check external signals. Did your social engagement spike the same day? Was there an active ad spend window? Ruling out other sources strengthens your attribution.
Pro Tip: Check follows, saves, and profile visits within 24–72 hours of placement. Then check again at 28 days. Algorithmic sources like Discovery Weekly inflate “programmed listener” counts without driving profile visits or follows — a key difference from genuine curator placements that bring active, curious listeners.
What to do in the 72 hours after a placement goes live
A placement without follow-through converts at a fraction of its potential. The window matters.
- Within 24 hours: Update your profile picture and bio if they are stale. Enable Canvas on the track. Pin the song as your Artist’s Pick. Share the placement on socials with a direct CTA: “Save it to your library” or “Follow me on Spotify so you don’t miss the next one.”
- 24–72 hours: Send to your email list. Add a pre-save or follow link to your link-in-bio. Run a boosted post targeting the cities showing up in your Top Cities data — those are people already listening.
- Weeks 1–4: Release related content (acoustic version, behind-the-scenes, lyric video) to keep the track active. Pitch to editorial playlists using your new traction data as evidence. If a specific city is overperforming, look at booking a show or running a geo-targeted ad there.
The goal is to move listeners from “heard it once on a playlist” to “follows the artist.” That gap is where most independent artists leave growth on the table.
How to spot a low-quality or fake placement
Not every promoter delivers what they promise. These are the signals that something is wrong.
- Streams spike sharply but follows, saves, and profile visits show zero movement.
- Streams are concentrated in a single region with very low listener counts — especially regions known for stream farming.
- The promoter cannot or will not share the curator’s name, a public playlist link, or a UTC timestamp.
- The playlist tab in Spotify for Artists shows no new playlists around the campaign date.
- Streams-per-listener drops below 1.0, suggesting very short session lengths or immediate skips.
If you suspect fraud: request written curator feedback and a public playlist link immediately. Pause any future payments. Export your Spotify for Artists data (Settings → Export) and document the discrepancy between the promoter’s claimed placement and what the dashboard shows. Algorithmic lifts from Discovery Weekly or Radio will show up under “programmed” sources in Source of Streams — not under editorial playlists. That distinction matters because programmed listeners rarely convert to followers.
How to set benchmarks and track results across campaigns
Before running any campaign, record your baseline: current weekly streams, monthly listeners, follower count, average saves per release, and top countries. Then track every campaign in a simple spreadsheet.
| Column | Example value |
|---|---|
| Campaign name | Spring indie push |
| Promoter | Intonality |
| Placement date (UTC) | March 14 |
| Playlist / curator | Indie Mornings / curator name |
| Follows gained | 28 |
For independent artists, rough benchmark ranges by scale: smaller catalogs typically see a modest day-one stream increase from a solid placement; mid-tier artists with an established base often observe a more substantial increase; artists with strong existing traction sometimes experience very large increases. A follow-to-stream ratio above 5% and a save rate above 10% of new listeners both indicate a quality placement. Release engagement data covering the first 28 days is the most reliable window for judging whether a campaign produced lasting interest or just a one-day spike.
What should you ask your playlist promoter before paying?
Transparency is non-negotiable. Before any campaign, request the following in writing.
- Curator name and either a public playlist link or a verifiable contact.
- Placement date and time in UTC — not just “sometime this week.”
- Screenshot or public proof of your track appearing in the playlist.
- Written curator decision or feedback — even a brief note on why the curator accepted or declined.
- Campaign-level summary showing total pitches sent, placements confirmed, and estimated listener reach.
Valid proof is a public playlist URL you can open yourself, paired with a UTC timestamp that matches your dashboard. Weak proof is an anonymous screenshot of a private playlist with no curator identity attached. If a promoter offers only the latter, that is a problem.
Intonality provides real-time campaign updates and written curator feedback on every decision — accepted or declined. That means you get a named curator, a public playlist link, and a timestamp you can verify directly in your Spotify for Artists dashboard. Before submitting, confirm that the campaign tier you choose includes placement reporting at that level of detail.
Key Takeaways
Spotify for Artists analytics give you the exact tools to verify whether a playlist-promotion campaign produced real listeners — if you know which charts to check and which metrics to prioritize.
| Point | Details |
|---|---|
| Source of Streams is your first check | Open Music → song → Source of Streams to confirm streams came from a named curator playlist, not algorithmic sources. |
| Follows and saves outweigh raw streams | A placement that adds followers pays out for months via Release Radar; a stream spike with zero follows expires in days. |
| Always use UTC for timestamps | Match your promoter’s placement report to UTC dates in the dashboard — local time mismatches produce false correlations. |
| Track the 28-day window | Day-one spikes show reach; 28-day release engagement data shows whether listeners stuck around. |
| Intonality provides verifiable proof | Campaigns include curator names, public playlist links, and written feedback you can cross-check in your dashboard. |
Analytics-first promotion is the only kind worth buying
The conventional wisdom in independent music promotion is to chase streams. More streams, more visibility, more algorithmic love. That logic is not entirely wrong, but it puts the cart before the horse. Streams are an output. Follows, saves, and listener-conversion rates are the inputs that determine whether your next release lands with an audience or into a void.
What the data consistently shows is that artists who treat analytics as a feedback loop — not just a scoreboard — make better decisions about where to spend their promotion budget. A placement that brings 500 streams and 3 follows tells you something. So does one that brings 200 streams and 45 follows. The second campaign is worth ten times more, and most artists would not notice the difference without looking at the right metrics.
Intonality’s approach of genre-matched curator pitches with written feedback aligns directly with this. When a curator explains why they accepted or passed on a track, that is information you can use to sharpen the next pitch. When you can see the public playlist and the UTC timestamp, you can verify the placement yourself. That is what analytics-first promotion actually looks like in practice.
Intonality campaigns come with proof built in
Most playlist promoters hand you a stream count and call it a day. Intonality works differently: every campaign includes personalized pitches to vetted, genre-matched curators, real-time updates as decisions come in, and written curator feedback on every outcome. You get the curator’s name, a public playlist link, and a timestamp you can verify directly in your Spotify for Artists dashboard.
Before you pay for any promotion, you should be able to request: the curator’s name and public playlist URL, placement date in UTC, written curator feedback, and a campaign summary showing pitches sent versus placements confirmed. Intonality delivers all of that as standard. Whether your track is indie, dark pop, or something heavier, campaigns are matched to curators who actually listen in your genre. Submit your track to start a campaign you can verify from day one.
Useful sources
- Understanding your listener and follower stats — Spotify’s official documentation on listeners, followers, UTC timestamps, and release engagement. Start here when matching campaign dates to dashboard data.
- Analytics – Spotify for Artists — The main analytics hub covering streams, saves, audience segments, and playlist contributors. Use this to navigate to every chart referenced in this guide.
- How to Read Your Spotify for Artists Data — Explains Source of Streams, the Playlists tab, and how to interpret stream sources. Essential for attribution.
- Audience Segments in Spotify for Artists — Covers listener-conversion metrics, segment definitions, and how to track audience movement over time.
- Intonality playlist promotion — Campaign tiers, curator network details, and reporting features for independent artists buying verified placements.
- Submit Your Track — Start a campaign with curator-level reporting and written feedback included.