
Save rate is the percentage of listeners who add your track to their library, playlist, or “Liked Songs” after hearing it. You calculate it by dividing total saves by streams (or by listeners, depending on what you want to measure) for a given release window, then checking the result in Spotify for Artists. For independent artists, a save rate in a moderate range is typical, a higher range indicates strong engagement, and very high save rates usually point to a track that’s found its exact audience.
Saves aren’t a vanity metric. Spotify treats them as one of the clearest signals that a listener actually wanted the song, not just tolerated it, and that carries real weight in what gets pitched to Discover Weekly and Release Radar. A track with modest streams but a healthy save rate often outperforms a track with ten times the plays and almost no saves.
Key Takeaways
Save rate, measured as saves divided by listeners over a matched date range, is the clearest signal Spotify’s algorithm uses to judge whether a track deserves wider playlist distribution.
| Point | Details |
|---|---|
| Use listeners, not streams | Divide saves by listeners, not total streams, for a save rate that reflects genuine audience conviction. |
| Match your benchmarks to traffic source | Expect 2% to 4% from playlists, 3% to 5% from owned promotion, and above 4% to 7% as strong across the board. |
| Track three windows | Check saves at day 7 for early signal, day 28 for algorithmic pickup, and day 90 for staying power. |
| Fix the intro before anything else | Front-load your hook within the first 20 to 30 seconds since skip decisions and save decisions both happen fast. |
| Target genre-fit listeners with Intonality | Intonality pitches real curators matched to your genre, averaging 4 to 11 placements per campaign with written feedback on every decision. |
Table of Contents
- What Save Rate Actually Measures and How to Calculate It
- Why Saves Drive Playlist Placement and Algorithmic Reach
- Save Rate Benchmarks by Traffic Source
- Tracking Save Rate Across the 7, 28, and 90 Day Windows
- A Prioritized Playbook for Increasing Your Save Rate
- Diagnosing a Low or Misleading Save Rate
- How Intonality Builds Save-Focused Campaigns
- Why Chasing Streams Instead of Saves Is the Wrong Play
- Get Your Music in Front of Curators Who Actually Save It
- Frequently Asked Questions
- Sources
What Save Rate Actually Measures and How to Calculate It
Streams tell you how many times a song played. Listeners tell you how many unique people played it. Saves tell you how many of those people cared enough to keep it. Confusing these three numbers is the single most common mistake artists make when judging a release, because a track can rack up streams from playlist autoplay while almost nobody actually chooses to keep it.
The formula that matters most is saves divided by listeners, not saves divided by streams. Streams inflate the denominator with repeat plays from the same small group of fans, which quietly deflates your percentage and makes a genuinely strong release look mediocre. Listeners give you a cleaner picture of how many distinct people made a save decision. Spotify’s own guidance on release engagement stresses matching date ranges between your saves and stream data. Pulling saves from a 28 day window while pulling streams from a 90 day window will produce a number that means nothing.
Here’s how to pull the numbers yourself:
- Select the specific track or release you want to analyze.
- Set the date range to match exactly across both metrics, whether that’s 7, 28, or 90 days.
- Note total saves and total listeners (found under the Audience data section) for that identical window.
- Divide saves by listeners and multiply by 100.
A worked example makes this concrete:
Notice how the same release produces two very different numbers depending on which formula you use. The saves-to-streams version undersells the track because most of those 11,600 streams came from a smaller pool of people replaying it.
Why Saves Drive Playlist Placement and Algorithmic Reach
Spotify doesn’t judge a song on plays alone. It reads a bundle of engagement signals together, including save rate, skip rate, completion rate, stream-to-listener ratio, and follow conversions, and it weighs saves heavily because they represent deliberate action rather than passive listening.
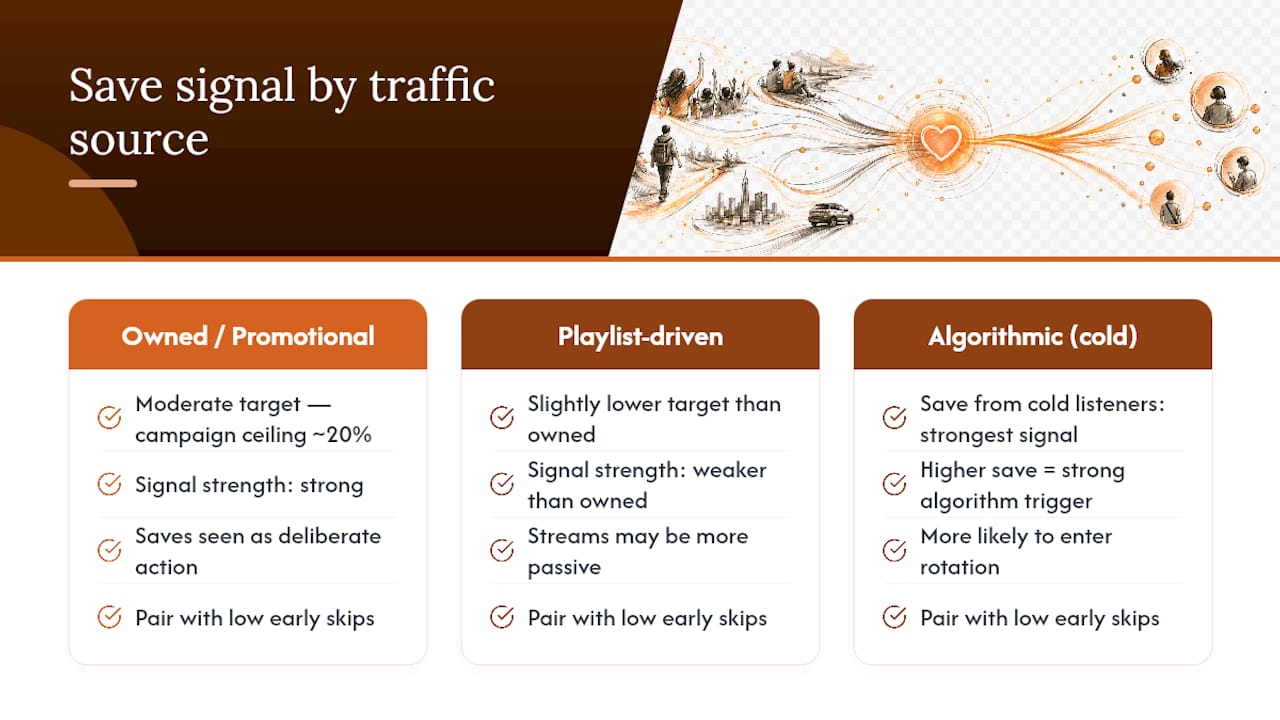
Save rate functions as a stronger indicator of song quality and audience fit than raw stream counts, and guides commonly recommend aiming for moderate save rates from owned or promotional traffic and slightly lower from playlist-driven streams, with higher save rates read as a strong result.
That distinction between traffic sources matters because it changes what “good” looks like depending on where the listener came from, a point covered in more depth in the next section. A save from someone who found your track through a cold algorithmic playlist is a much stronger signal than a save from a fan who already follows you, because the algorithmic listener had zero prior loyalty to overcome.
Industry analyses of what pushes tracks into algorithmic rotation consistently name saves as a top-weighted factor, alongside how a track’s stream-to-listener ratio behaves. One industry breakdown of Spotify save tactics notes that tracks with higher save rates are considerably more likely to land on algorithmic playlists compared to tracks that only rack up passive streams. That’s the practical reason two songs with identical stream counts can have wildly different fates: one keeps getting pushed by Discover Weekly and Radio, the other quietly disappears after its first playlist run.
But saves in isolation don’t guarantee anything. Spotify pairs the save signal against skip behavior. The two signals need to move together: high saves, low early skips, and ideally some repeat listening from the same accounts within the first week.
Here’s the part most artists miss. A campaign analysis from Chartlex frames that 20% figure as a campaign-specific trigger, not a universal benchmark. Treat it as a ceiling reached under ideal, tightly targeted conditions, not a number every release needs to hit.
Save Rate Benchmarks by Traffic Source
The same save-rate percentage can mean completely different things depending on where the listens originated.
A few rules of thumb make these numbers usable in practice:
- The first 48 to 72 hours matter disproportionately because Spotify’s algorithm samples early engagement to decide how aggressively to keep pushing a track.
- The 28-day window gives a fuller picture and smooths out the noise of any single viral moment or bot spike.
- A cold playlist add that produces even a 2% save rate outperforms a follower push that produces 4%, because the cold audience had no prior investment in you.
- Watch the trend line across both windows rather than fixating on one snapshot. A save rate that climbs from day 7 to day 28 tells you the algorithm is finding better-fit listeners over time.
Tracking Save Rate Across the 7, 28, and 90 Day Windows
Each measurement window answers a different question. The 7-day window tells you whether your initial push, presaves, fan outreach, and any early playlist adds, actually converted into saves. The 28-day window tells you whether the algorithm picked the track up and started feeding it to new listeners on its own. The 90-day window tells you whether the song has staying power or whether it faded once the initial promotional push ran dry.
Here’s a simple weekly routine that keeps you from drowning in numbers you don’t need yet:
- Open the Music tab in Spotify for Artists and select the release.
- Check saves and listeners for the trailing 7 days first, since this window reacts fastest to any new promotional push.
- Note the stream-to-listener ratio, a rough proxy for how much repeat listening is happening among people who already found the track.
- Check skip rate if it’s available for the release; a rising skip rate alongside falling saves is an early warning sign.
- Once you hit day 28, compare that broader window against your day 7 numbers to see whether the algorithm expanded your reach or let it plateau.
The four numbers worth tracking every time are save rate, stream-to-listener ratio, skip rate, and follower conversion, meaning how many new followers a release generated relative to its listener count.
Pro Tip: Set a recurring calendar reminder for day 7, day 28, and day 90 after every release. Missing the day 7 check is the most common reason artists misread a slow start as a failure when the track just needed another two weeks to find its footing.
A Prioritized Playbook for Increasing Your Save Rate
Not every tactic deserves equal attention. Some move your save rate meaningfully within days; others are slower plays that compound over months. Here’s the order that tends to produce the fastest, most reliable gains.
-
Lock in presaves before release day. A presave campaign or countdown page converts intent into a guaranteed day-one save, and it front-loads your engagement data before the algorithm even starts evaluating the track. Spotify’s own data on super listeners shows this group, roughly 2% of an artist’s monthly listeners, drives more than 18% of monthly streams, and presave campaigns are one of the most reliable ways to activate them early.
-
Go straight to your existing fans first. Direct links sent through email, SMS, and DMs outperform a general social post because they remove friction. Someone who clicks a link you sent them personally is far more likely to save the track than someone who scrolls past a feed post. This is also where a resource like Intonality’s guide on Spotify marketing strategy helps artists sequence outreach so the highest-intent fans hear the song first, before any wider push begins.
-
Fix your intro before you fix anything else creative. Save decisions and skip decisions both happen fast, often within the first 20 to 30 seconds. Front-loading your strongest hook, and repeating a memorable motif around the 40 and 60 second marks, measurably improves both retention and save likelihood, according to audio feature analyses covered in the Orion Distro save-rate breakdown. If your song builds slowly for 45 seconds before it gets good, you’re losing a chunk of listeners before they ever get the chance to decide whether they like it.
-
Add a Canvas. The looping visual attached to a track increases the odds a listener stays engaged long enough to make a save decision instead of swiping past. It’s a small production lift with an outsized effect on completion behavior.
-
Pitch curators who actually match your genre, not just any curator with a large following. A save from a listener who follows a hyper-specific genre playlist carries more algorithmic weight than a save from someone who stumbled onto a generic mood playlist. Intonality’s guide to submitting tracks to Spotify playlists walks through how to identify curators whose existing audience overlaps with your sound.
-
Avoid bot playlists and fake-stream services entirely. They inflate stream counts while doing nothing for saves, and the resulting mismatch, high streams, near-zero saves, is one of the fastest ways to tank your credibility with Spotify’s own quality signals.
-
Follow up after the first week. A short “this one’s doing well, give it a save if you haven’t yet” message to engaged fans, or a repost highlighting playlist adds, can meaningfully lift save totals in the second week without any new spend.
A few tactical notes worth keeping in your back pocket:
- Countdown pages tend to outperform a bare presave link because they create a reason to visit more than once.
- Genre-fit curator pitches convert at meaningfully higher save rates than mass submissions to generic curators.
- Social proof, screenshots of playlist adds or listener comments, gives fence-sitting fans a nudge to act.
Pro Tip: Sequence your outreach in this order: presave push in the week before release, a concentrated day-one push to your most engaged fans and genre-fit curators, a measurement checkpoint at day 7, and a fresh follow-up push at day 14 to catch anyone who missed the first round.
Diagnosing a Low or Misleading Save Rate
A weak save rate isn’t always a songwriting problem. Sometimes it’s a measurement problem, a targeting problem, or a fraud problem, and figuring out which one you’re dealing with changes what you do next.
- Check for signs of fake or bot-driven streams: a sudden stream spike with an almost flat save count, or streams originating from playlists you never pitched to and don’t recognize, is a red flag worth investigating before you touch anything creative.
- Look at your skip rate in the first 30 seconds. A high early skip rate paired with a low save rate usually means the intro isn’t earning attention fast enough, not that the whole song is weak.
- Audit where your traffic is coming from. A save rate that looks weak against a follower benchmark might actually be solid once you realize most of the streams came from cold, algorithmic playlist placements.
- Run a small A/B test before assuming it’s the song. Send two different clips, one built around your current intro, one built around a different section, to two comparable fan segments and see which one produces more saves.
- If saves stay flat even among your most engaged listeners after ruling out the above, the issue is more likely the material itself than the promotion strategy.
How Intonality Builds Save-Focused Campaigns
Intonality runs campaigns around one core idea: a save is only meaningful if it comes from a listener who genuinely fits the song. Rather than blasting a track to hundreds of playlists indiscriminately, Intonality pitches personally to real, vetted curators whose existing playlists already match an artist’s genre, which raises the odds that the resulting streams convert into actual saves instead of passive, disengaged plays.
- Each pitch goes to a human curator, not an automated submission queue, and every decision comes back with written feedback so artists know why a curator passed or accepted.
- Campaigns average 4 to 11 playlist placements depending on the service tier, giving artists a concrete range to plan around rather than a vague promise.
- Real-time updates let artists track placements as they happen, which pairs naturally with the Spotify for Artists checks covered earlier in this guide.
- Genre-matching reduces the mismatch problem covered in the diagnostics section above: a curator-approved placement lands your track in front of listeners who are statistically far more likely to save it than a random algorithmic drop would.
The written feedback loop is what separates this from most promotion services. When a curator declines a pitch, artists get a reason, not silence, which turns every campaign into usable data about how the song is actually landing with real listeners.
Why Chasing Streams Instead of Saves Is the Wrong Play
Most independent artists still obsess over stream counts because that’s the number that feels the most tangible. But streams alone don’t tell you whether anyone cared. A track can rack up 50,000 streams off a single high-traffic playlist and vanish the moment that placement ends, while a track with a fraction of the plays and a strong save rate keeps compounding for months.

Prioritize your super listeners and your measurement discipline over raw play counts, because those are the two levers that actually move the algorithm in your favor. If you’re starting a new release cycle, the single highest-leverage move is locking in presaves and concentrating your day-one push on the fans and curators most likely to convert into saves, then checking your numbers at day 7 before you draw any conclusions.
Get Your Music in Front of Curators Who Actually Save It
Every tactic in this guide points to the same bottleneck: you need real listeners who fit your genre, not a flood of streams that fade the moment a playlist rotation ends. Intonality solves that bottleneck directly by pitching your track to vetted, genre-matched curators instead of relying on automated blasts or pay-to-play playlist farms.
Every pitch gets written feedback, whether it’s accepted or declined, so you’re never guessing why a curator passed. Campaigns typically land 4 to 11 real playlist placements depending on the tier you choose, and real-time updates let you track exactly when and where those placements happen. If you’ve been relying on DIY submissions or automated services and want to compare the outcome, Intonality’s Playlist Push alternative breaks down how the curator-first approach differs. Start a campaign today and see how genre-matched placements move your save rate in the first 28 days.
Frequently Asked Questions
What is a good Spotify save rate for independent artists?
Should I calculate save rate using streams or listeners? Use listeners. Dividing saves by streams undercounts your real performance because streams include repeat plays from the same small group of fans, which artificially lowers the percentage.
How quickly does save rate affect algorithmic playlists like Discover Weekly? Spotify samples early engagement heavily, so the first 48 to 72 hours often shape how aggressively a track gets pushed, with the 28-day window confirming whether that early momentum held.
Can a high stream count with a low save rate still be a good sign? Not usually. High streams with minimal saves often means the audience is passive or the traffic includes bot activity, and it’s one of the clearest warning signs worth investigating before assuming the promotion worked.
Does Canvas actually improve save rate? Industry guidance points to Canvas increasing completion and engagement by keeping listeners visually anchored to the track, which indirectly supports higher save rates, though it works best paired with a strong opening hook rather than as a standalone fix.
Sources
- Super listeners: your guide for developing fans who go deeper — Spotify for Artists
- Release engagement — Spotify for Artists (support)
- Save rate vs streams — Orphiq
- How to improve Spotify saves — Orion Distro


