
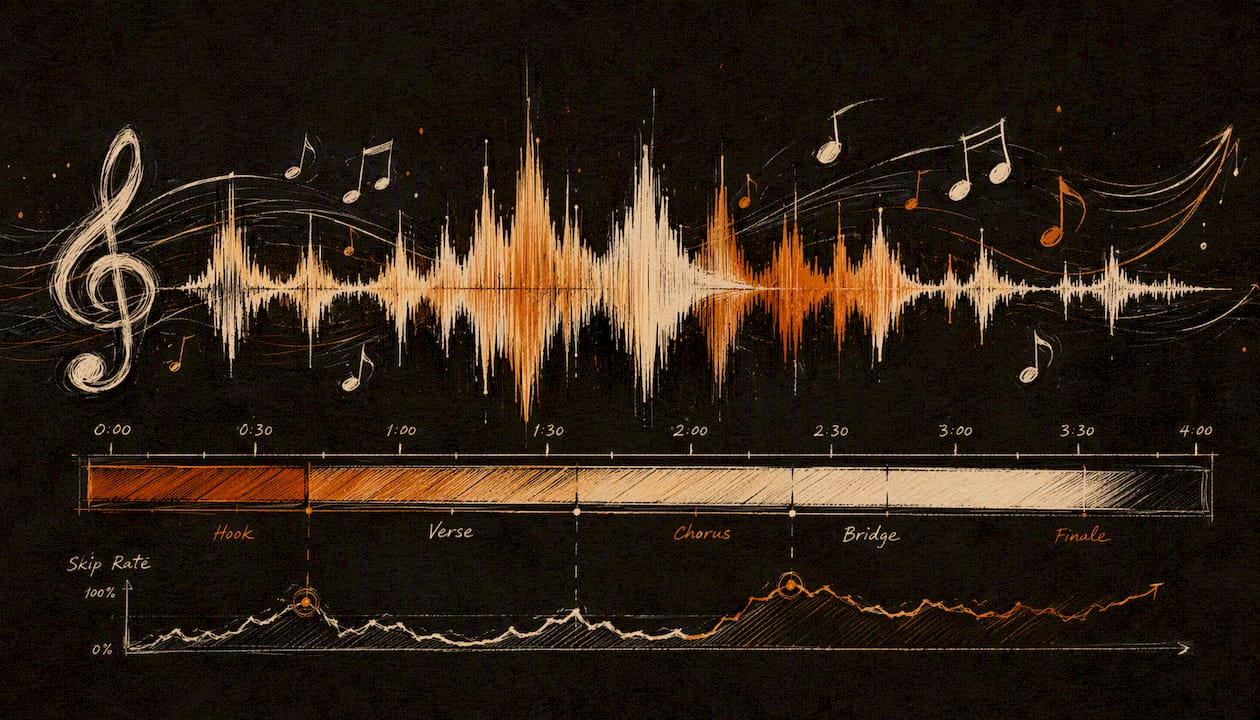
Your Spotify skip rate is the percentage of listeners who bail on your track before it ends, and it directly shapes whether Spotify’s algorithm pushes your music to new ears or quietly buries it.
Before diving into the full diagnostics, here are two things to do right now:
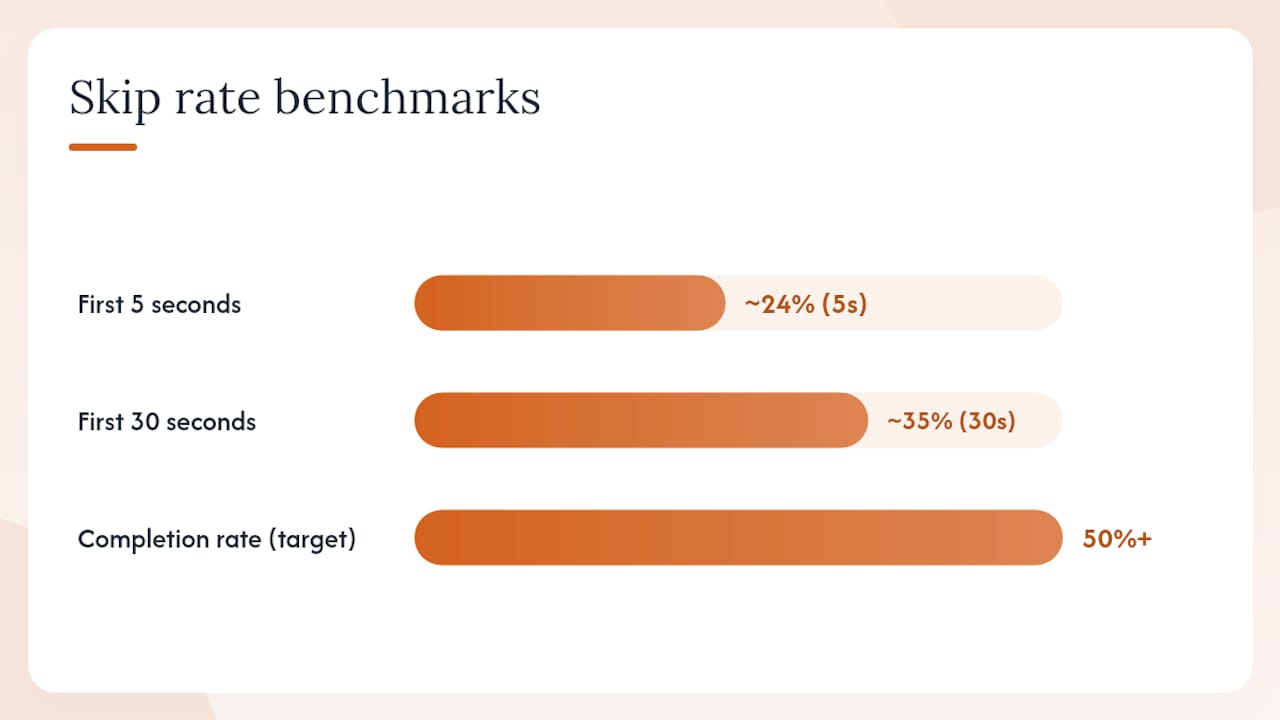
- Diagnose first: Open Spotify for Artists and pull up the timeline graph for your most recent release. Look for a steep drop in the first 10 seconds or a sudden cliff around the 30-second mark. Research indicates that roughly 24% of tracks are skipped within the first 5 seconds and approximately 35% are skipped before the 30-second mark. That pattern tells you more than any single number.
- Quick fix: If you see an early drop, shorten or rework your intro. Move the hook to the first 5–8 seconds. This one change tends to have the highest return for the least effort.
The sections below walk through benchmarks, root causes, research-backed diagnostics, and a prioritization framework so you can act on what actually matters.
Table of Contents
- What skip rate and completion rate actually measure
- What counts as a good or bad skip rate?
- Common causes of high skip rates
- How to build a skip profile and find where listeners drop off
- What research tells us about why listeners skip when they do
- Concrete steps to reduce your skip rate
- How to test changes and measure whether they worked
- A simple framework for deciding what to fix first
- Key Takeaways
- The skip rate metric most artists misread
- How Intonality helps you test edits and reach better-matched listeners
- Useful sources for artists who want to dig deeper
What skip rate and completion rate actually measure
Skip rate and completion rate are two sides of the same coin, but they measure different things. Skip rate counts the share of streams where a listener pressed forward, swiped, or let autoplay move on before your track finished. Completion rate flips that: it measures the share of streams where someone listened all the way through.
Spotify does not display a labeled “skip rate” percentage inside Spotify for Artists. What you get instead are proxies that, read together, paint a clear picture. The Music tab shows streams, listeners, and saves over time. The Release engagement report shows how actively your audience engaged during the critical window after a release. Timeline graphs let you watch how streams trend day by day, and sudden drops after the first week often reflect poor listener retention.
The Release engagement metric uses an active-audience calculation, not a raw stream count, so it weights listeners who returned or saved the track more heavily than passive one-time plays. According to Spotify’s support documentation, most analytics inside Spotify for Artists refresh every 15 minutes, but some metrics, including certain engagement calculations, can take up to 48 hours to fully update. That lag matters when you are running a short test campaign and checking results the next morning.
Completion rate is the metric to watch alongside streams. A track with 10,000 streams but a low save rate and flat follower growth is almost certainly suffering from high skip activity, even if Spotify never hands you that number directly.
What counts as a good or bad skip rate?
There is no single universal benchmark, and any source that gives you one clean number without context is oversimplifying. Skip behavior varies by genre, playlist type, device, and where in a listening session your track appears.
That said, research gives us useful reference points. According to skip prediction literature, roughly 24% of tracks are skipped within the first 5 seconds, and approximately 35% are skipped before the 30-second mark. Those figures come from large-scale streaming data and represent averages across all contexts, not a floor you should accept for your own releases.
| Skip window | Typical rate | What it signals |
|---|---|---|
| First 5 seconds | ~24% | Intro or opening hook is not landing |
| First 30 seconds | ~35% | Hook arrives too late or production feels off |
| Full track (completion) | Varies widely | Genre and context dependent; aim above half |
| Catalog/personalized playlists | Lower than charts | Engaged, self-selected audience |
| Radio/charts playlists | Higher | Passive listeners, more browsing behavior |
Stat to know: A significant portion of tracks are skipped before the 30-second mark across streaming platforms, which is also the threshold Spotify uses to count a stream as paid. Getting listeners past that point is both a revenue and a retention goal.
Genre matters a lot here. Electronic and hip-hop tracks with immediate drops tend to hold listeners better in the first 10 seconds than slow-build folk or ambient tracks. A high skip rate before 30 seconds might be alarming for a pop track and fairly normal for a 7-minute progressive piece. Context matters just as much: research on listener segmentation shows that catalog and personalized playlists attract a higher share of engaged “listener” types, while charts and radio sessions skew toward “skipper” behavior. Where your track lives affects what skip rate you should expect.
The practical target: aim for a completion rate above half on catalog and personalized playlist placements. If you are consistently below that on those contexts, the song or its placement has a problem worth fixing.
Common causes of high skip rates
Most skip problems trace back to a handful of root causes. Here is a prioritized checklist, ordered by how often each one shows up and how quickly you can address it.
- Audience or playlist mismatch. Getting placed on the wrong playlist is often worse than no placement at all. A moody indie ballad dropped into a high-energy workout playlist will get skipped at a brutal rate. Mismatched Spotify genre tags feed the algorithm bad data and attract the wrong listeners.
How to build a skip profile and find where listeners drop off
A skip profile maps listener drop-off across the full length of your track. Spotify for Artists does not give you a second-by-second graph the way YouTube Analytics does, but you can reconstruct a useful picture by combining several data points.
Step 1: Pull your timeline and Release engagement data. In Spotify for Artists, go to the Music tab, select your track, and examine the streams timeline. A healthy release shows a peak around days 1–3, then a gradual decline. A sharp cliff after day 3 often means listeners who found the track early did not return or save it, which is a retention signal.
Step 2: Segment your listener sources. The Release engagement report lets you filter by listener type. Separate your programmed playlist listeners from your followers and catalog listeners. Research on listener behavior types confirms that these groups behave very differently. A high skip signal from radio listeners is less alarming than the same signal from your own followers.
Step 3: Interpret the drop pattern. Two scenarios tell you different things:
- A 40% drop in the first 10 seconds from playlist listeners points directly at the intro. The hook is not arriving fast enough for a cold audience.
- A 25% drop around the 1:20 mark from album listeners suggests a structural issue, probably a transition or a bridge that loses momentum. That is a mixing or arrangement problem, not an intro problem.
Step 4: Cross-reference with saves and follows. A track with decent streams but near-zero saves is being heard but not valued. That combination, high plays and low saves, is one of the clearest signs of a skip-heavy listening pattern even without explicit skip data. Premium listeners and those in non-shuffle modes tend to skip less, according to skip prediction research, so filtering your data by those contexts when possible gives you a cleaner signal.
What research tells us about why listeners skip when they do
The academic evidence on skip behavior is more useful for artists than most people realize. Studies analyzing billions of streaming events find that skip profiles are song-specific and stable across time and geography. The same track tends to lose listeners at the same moments whether it is played in January or July, in New York or Tokyo. That stability is actually good news: it means the skip pattern is telling you something real about the song, not just about random listener mood.
The most consistent finding is a U-shaped skip curve. Skips cluster at the very beginning of a track, drop during the middle, then rise again near the end. The early spike is the intro problem. The late spike is listeners moving on before the outro finishes.
More precisely, research using event-response models shows that skip spikes do not happen randomly between structural events. They follow section boundaries and transitions, with a short delay of roughly 3–4 seconds from the boundary to the observed spike. A listener hears the chorus end, registers that the verse is starting again, and skips. That delay is why artists often misidentify the problem: the skip registers a few seconds after the actual musical moment that triggered it.
Here is a practical three-step method to use this research:
- Map the spike — Identify the time in your track where the drop-off is steepest, using Spotify for Artists timeline data and any additional analytics from your distributor.
Pro Tip: Run your edited version through a small, targeted promotion campaign before re-releasing it widely. A narrow test with 200–300 streams from a matched audience gives you enough signal to confirm whether the edit actually moved the needle, without burning your release window.
Concrete steps to reduce your skip rate
Short-term fixes address the most common causes quickly. Long-term changes require more investment but compound over time.
- Fix your metadata and genre tags. Make sure your genre tags, mood descriptors, and track title accurately represent what the listener will hear. Mismatched expectations drive skips before the song even has a chance. A guide on Spotify genre tags can help you pick the right ones.
- Target better-fit playlists. Getting placed on a playlist where listeners already love your genre is worth more than a placement on a high-follower list that does not match your sound. Use Spotify playlist submission strategies that prioritize genre alignment over raw follower count.
- Use pre-release feedback loops — Submit your track before release through Spotify for Artists’ editorial pitch tool. Curator feedback, whether from editorial or independent curators, often surfaces the same issues your skip data will later confirm.
How to test changes and measure whether they worked
Testing a track edit without a structured approach leads to false conclusions. Here is a reliable framework.
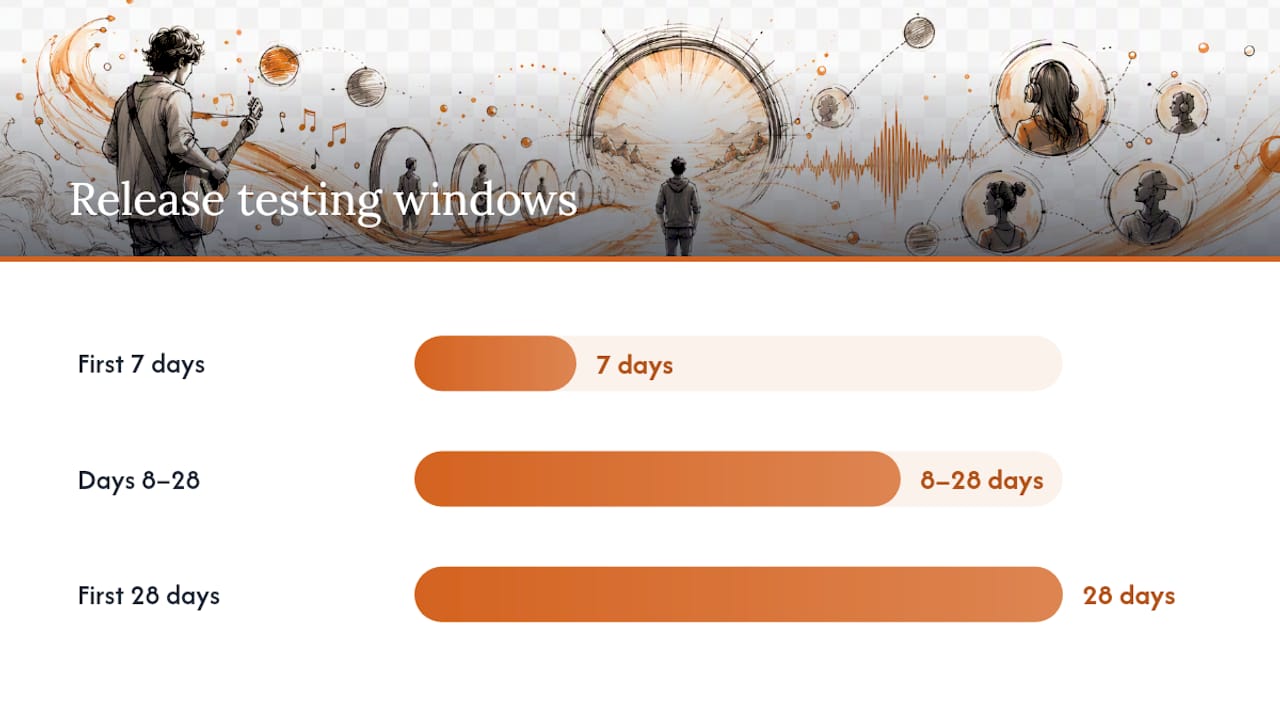
Use the right time windows. The first 28 days after a release carry the most weight for Spotify’s algorithmic evaluation. Within that window, the first 7 days show you the initial audience reaction, and days 8–28 show whether listeners are returning. For a re-release or an edited version, treat the reupload as a new release and watch the same windows.
Set up a control comparison. The cleanest test compares the same playlist cohort before and after your edit. If you ran a small promotion campaign on the original version, run a similarly sized campaign on the edited version with the same genre targeting. Differences in skip behavior between the two runs are more meaningful than comparing your track to industry averages.
Track the right supporting metrics. Skip rate proxies alone are not enough. Watch these alongside your timeline data in Spotify for Artists:
- Save rate (saves per stream)
- Follower conversion (new followers per listener)
- Repeat listen rate (listeners who played the track more than once)
- Release engagement score
According to Spotify’s Release engagement documentation, the metric refreshes on a cadence that can take up to 48 hours for some calculations, so wait at least two full days before drawing conclusions from a new campaign push.
Avoid over-reading small samples. A track with fewer than 500 streams in a test window does not have enough data to confirm a trend. If your test campaign is small, focus on directional signals (saves going up, engagement score improving) rather than precise percentages.
A simple framework for deciding what to fix first
Not every skip problem deserves the same urgency. This matrix helps you prioritize when time and budget are limited.
- High impact, low effort (fix immediately): Shorten the intro, trim trailing silence, fix metadata. These changes take an hour and address the most common skip triggers. A spike in the first 8 seconds from playlist listeners almost always falls here.
- High impact, high effort (plan carefully): Re-record a vocal, rearrange the song structure, or commission a new mix. Worth doing if the data consistently points to a structural problem, but do not start here without confirming the diagnosis first.
- Low impact, low effort (do if convenient): Adjust artwork, update playlist pitch copy, tweak the track title. These rarely move skip rate directly but can improve click-through and set better expectations.
- Low impact, high effort (skip for now): Wholesale re-recording, changing the genre direction of a track, or rebuilding a mix from scratch when the skip data is ambiguous. Save this energy for your next release.
Scenario examples:
- Small spike at 8 seconds from playlist listeners, flat saves: edit the intro. This is the clearest possible signal.
- Spike at 2:30 from album listeners, decent save rate: the song is resonating but losing momentum mid-track. Look at the arrangement around that timestamp, probably a bridge or a repeated section that overstays its welcome.
- High skip rate across all contexts, low saves: the song may need a more substantial fix, or the promotion is reaching the wrong audience entirely. Before touching the recording, test it on a more genre-matched audience and see if the numbers change.
When the data is ambiguous, promotion is often the right first move. Reaching a better-matched audience through a Spotify marketing strategy built around genre alignment can reveal whether the problem is the song or the audience.
Key Takeaways
Your Spotify skip rate is a diagnostic tool, not a verdict: pair it with saves, follows, and completion rate to find the one change that will actually move your numbers.
| Point | Details |
|---|---|
| Diagnose before you edit | Use Spotify for Artists timeline and Release engagement data to locate the exact drop-off moment before touching your recording. |
| First 30 seconds are critical | Research shows roughly 24% of tracks are skipped within the first 5 seconds, and about 35% are skipped before 30 seconds; getting listeners past that mark protects both retention and royalties. |
| Segment your listeners | Catalog and personalized playlist listeners skip less than radio or charts audiences; compare cohorts separately for a clean signal. |
| Test edits with small campaigns | Run a narrow promotion campaign on an edited version and compare saves, follows, and engagement scores against the original. |
| Intonality for validation | Intonality’s genre-matched curator campaigns deliver written feedback on every pitch, giving you a real-world test of whether an edit lands with the right audience. |
The skip rate metric most artists misread
Most artists treat a high skip rate as a verdict on their song. It rarely is. What it actually tells you is that something in the listening experience created friction at a specific moment, for a specific type of listener, in a specific context. Those three variables matter as much as the song itself.
The research on skip profiles is clarifying here. Skips are not random expressions of dislike. They follow musical events with a predictable delay, they cluster at structural transitions, and they vary systematically by listener type and session context. A listener in the middle of a long shuffle session who has already skipped two tracks is statistically more likely to skip yours regardless of quality. That is not a signal about your music.
What I find most useful is treating the skip profile as a map rather than a grade. When you see a spike, you have a coordinate. Something happened at that moment in the song that broke the listener’s engagement. Your job is to identify what it was, make the smallest possible change, and test it on a real audience before assuming you have solved it. Over-reacting to a single data point, especially from a small sample, leads to unnecessary rewrites and second-guessing that rarely improves the music.
The artists who get the most out of this data are the ones who stay curious rather than defensive. A spike at 1:45 is not an insult. It is a question worth answering.
How Intonality helps you test edits and reach better-matched listeners
Getting your skip rate down is only half the equation. The other half is making sure the right listeners are hearing your track in the first place, because even a perfectly crafted song will show inflated skip numbers if it keeps landing in front of the wrong audience.
Intonality pitches your track personally to vetted, genre-matched curators instead of blasting it through automated systems. Every curator decision comes with written feedback, which means you learn not just whether a curator added your track but why they passed if they did. That feedback loop is genuinely useful when you are testing an edited version: if three curators in the same genre independently flag the same moment as a concern, that is a stronger signal than any analytics graph.
Campaigns average 4 to 11 playlist placements depending on the tier, and every placement goes to a real playlist with real listeners who already like your genre. That is the kind of audience where your skip data actually means something. You can submit your track before release to get placements and feedback during the window that matters most algorithmically, or run a post-release campaign to test an edited version against a matched audience. Either way, you get data you can act on, not just a stream count.
Useful sources for artists who want to dig deeper
The following resources back the claims in this guide and are worth bookmarking for ongoing reference.
- The skipping behavior of users of music streaming services and its relation to musical structure — PMC
- The universality of skipping behaviours on music streaming platforms
- Skip prediction using boosting trees based on acoustic features of tracks in sessions
- Release engagement
- Why People Skip Music? On Predicting Music Skips using Deep Reinforcement Learning
- On Skipping Behaviour Types in Music Streaming Sessions
This article is general information for educational purposes. For decisions about your specific releases, distribution agreements, or platform policies, verify current guidelines directly with Spotify for Artists or consult a music industry professional.


