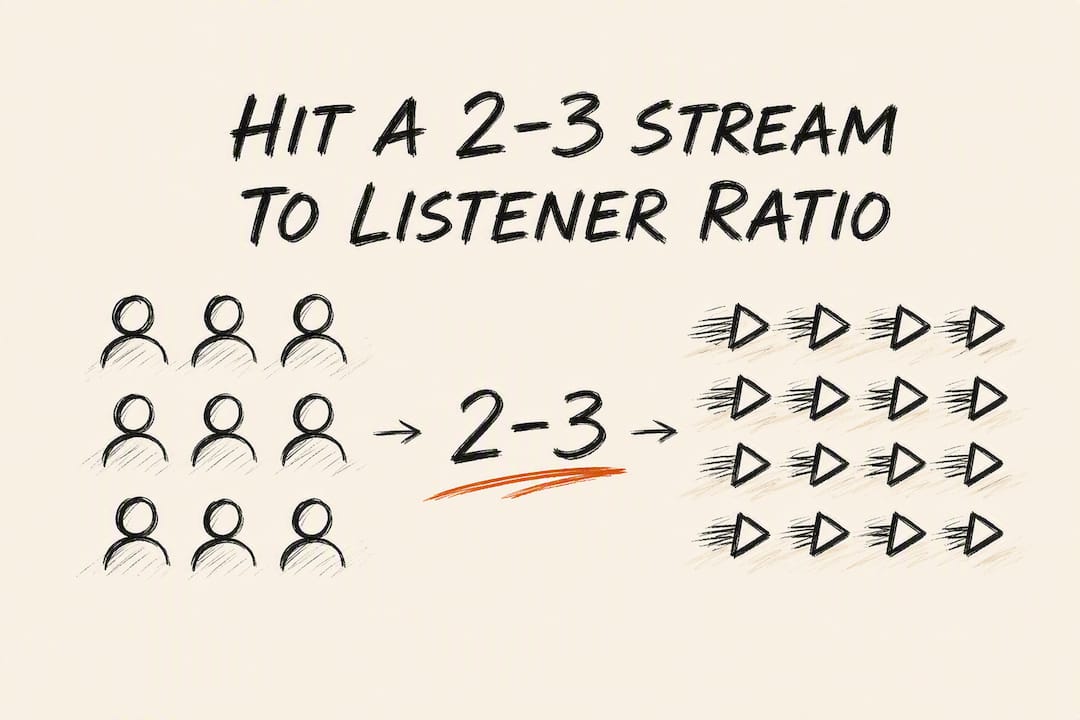
Your stream to listener ratio is streams divided by monthly listeners over the same 28-day window, and for most independent artists, a healthy number is between 2 and 3. Anything close to 1.0 to 1.5 usually means your reach is wide but shallow, often the result of a fresh playlist spike. A ratio above 4 typically signals a small but genuinely obsessed fanbase or a deep catalog people are looping through.
TL;DR:
- A stream to listener ratio between 2 and 3 over 28 days indicates healthy engagement, with lower ratios often reflecting playlist spikes and higher ratios signifying dedicated fanbases or catalog looping.
- Playlist placements from genre-matched curators tend to generate more repeat listens, positively impacting your ratio and fostering genuine fan engagement.
- Tracking the ratio across multiple 28-day windows, alongside save rate and follower growth, provides a clearer picture of true audience quality than immediate spikes or dips.
- Content strategies like asking for saves, building curated playlists, and sequencing releases can help convert casual listeners into repeat supporters.
- Avoid interpreting ratio changes without considering playlist placements, catalog size, and engagement metrics, as short-term spikes do not necessarily reflect sustained growth.
Table of Contents
- What Streams-Per-Listener Actually Measures and How to Calculate It
- Benchmark Ranges: What Each Band Actually Tells You
- Why Playlist Spikes and Catalog Size Change the Numbers
- How to Improve Your Stream to Listener Ratio
- How Genre-Matched Curator Placements Change Real Engagement
- The Ratio Is a Signal, Not the Whole Scoreboard
- Build Repeat Listeners With Curator Placements That Actually Fit Your Sound
- Sources
- FAQ
What Streams-Per-Listener Actually Measures and How to Calculate It
Spotify counts a “stream” once a track plays for at least 30 seconds, and a “monthly listener” is anyone who streamed at least one of your songs in the trailing 28 days. Divide the first number by the second, using the exact same window for both, and you get your ratio.
The formula:
Streams ÷ Monthly Listeners = Stream to Listener Ratio
Two quick examples show why context matters:
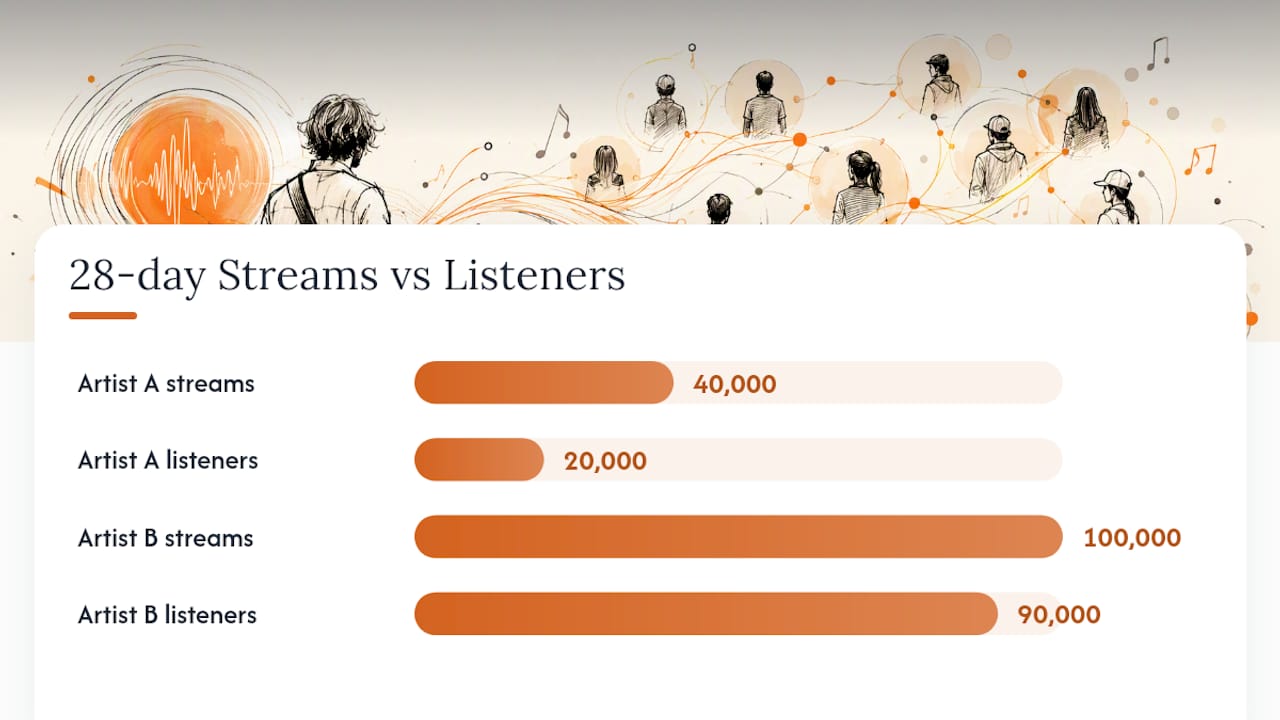
- Artist A gets 40,000 streams and 20,000 monthly listeners in a 28-day window. That’s a ratio of 2.0, a solid sign that a good chunk of listeners are coming back for repeat plays.
- Artist B gets 100,000 streams from 90,000 monthly listeners after landing on a large editorial playlist. That’s a ratio of 1.1, meaning most people heard the track once and moved on.
The most common calculation mistake is mismatching windows, pulling total career streams against last month’s listener count. Spotify for Artists reports both figures on rolling 28-day cycles, and comparing streams to listeners in the same window is the only way the math holds up.
Benchmark Ranges: What Each Band Actually Tells You
Not every low ratio is bad news, and not every high one is a win. Here’s how to read the bands:
- 1.0 to 1.5: Passive or discovery-driven reach. Common right after a playlist add, a viral clip, or a big algorithmic push. Not a problem on its own, but worth watching over the next few cycles.
- 2 to 3: The zone most working independent artists land in when things are healthy. It suggests a mix of new discovery and repeat plays from people who actually like the music.
- 4 and above: A tight, devoted core audience, deep catalog looping, or both. Great for loyalty, though it can also mean your reach has plateaued.
A commonly cited benchmark puts the healthy zone at roughly 2 to 3 for many independent acts, with anything near 1.0 to 1.5 flagging shallow reach and 4-plus flagging either a loyal core or a heavy catalog effect. Superstar-tier artists sometimes post ratios far beyond these ranges, which is a reminder that career stage changes what “good” looks like. A brand-new single with a 1.3 ratio and 500 listeners is a different story than a five-year catalog with a 1.3 ratio and 500,000 listeners.
Why Playlist Spikes and Catalog Size Change the Numbers
Your ratio isn’t a fixed trait. It moves with whatever is happening to your catalog that month, and reading it without context leads to bad conclusions.
Editorial and algorithmic playlist placements are the biggest short-term driver. A big playlist add can double or triple your monthly listeners overnight while your stream count grows more slowly, which mechanically drags the ratio down. That’s not a failure. As placements age off and listener counts fall back, the ratio often climbs again because the people still listening are the ones who actually stuck around.
Catalog depth works the other direction. Artists with ten albums naturally rack up more streams per listener than artists with two singles, simply because there’s more music to loop through. A small, devoted fanbase replaying your back catalog will also push the number up without any new listeners at all.
To separate a real trend from noise:
- Track the ratio across at least three to four consecutive 28-day windows, not a single snapshot.
- Cross-check it against save rate, follower growth, and skip rate to see whether engagement is rising alongside it.
- Note any playlist placements or press mentions from that period so you’re not misreading a spike as organic growth (or a drop as decline).
How to Improve Your Stream to Listener Ratio
Raising your ratio comes down to converting casual listeners into repeat ones, and that takes deliberate moves, not luck.
- Ask for saves and follows directly. A caption that says “save this if it’s stuck in your head” outperforms silence. Saves and follows are the clearest signal that a listener plans to come back.
- Build your own curated playlists. Mixing your tracks with similar artists gives fans a reason to keep the session going instead of skipping to something else after one song.
- Sequence your releases to point backward. Use outros, pre-save links, and artist profile ordering to nudge new listeners from your latest single into your back catalog.
- Pitch genre-matched curators instead of generic playlists. A curator whose audience already likes your sound is far more likely to send you listeners who stay, not just sample.
- Pace your releases with intent. Dropping new music every 6 to 8 weeks keeps your name in the algorithm’s rotation without flooding listeners faster than they can absorb it.
Measure the impact with a simple before-and-after plan: track your 28-day ratio, save rate, follower count, and skip rate in the two windows before and after any campaign. Consistent, denominator-matched formulas are what make engagement comparisons over time actually trustworthy instead of guesswork dressed up as data.
Pro Tip: Don’t judge a campaign by week one. Playlist-driven listener spikes take two to three 28-day cycles to settle, so the real read on whether a placement built lasting fans comes later, not immediately after the add.
A short do/don’t list to keep you honest:
- Do prioritize curators whose genre and audience actually match your sound.
- Do treat rising saves and followers as corroborating evidence, not just the raw ratio alone.
- Don’t buy fake streams or bot playlist adds. They inflate the numerator without touching real listener behavior, and Spotify’s fraud detection has gotten sharper about spotting them.
- Don’t panic over one bad week. Look at trend lines, not single data points.
How Genre-Matched Curator Placements Change Real Engagement
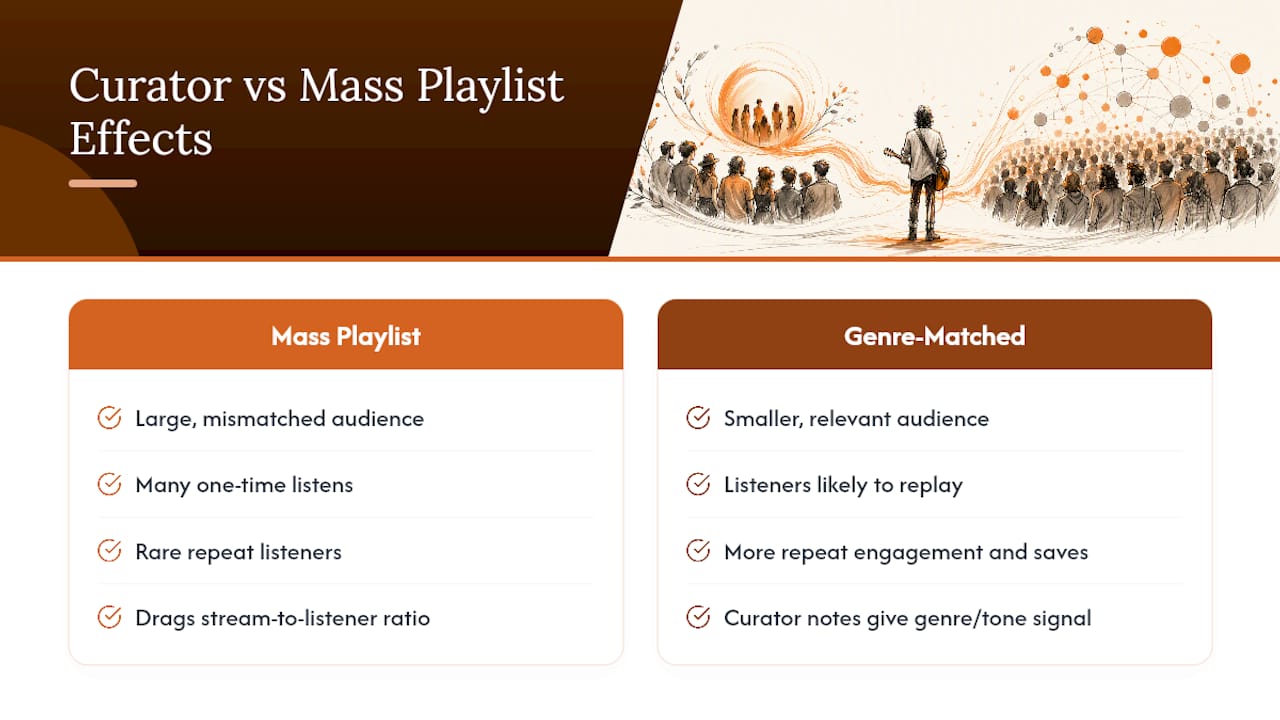
Not all playlist placements behave the same way once they hit your stream to listener ratio. A mass playlist stuffed with mismatched genres tends to generate a burst of one-time listens that drag your ratio down and rarely come back. A vetted, genre-matched curator sends a smaller but more relevant audience, and those listeners are more likely to replay a track that already fits what they were looking for.
Campaign data from a music promotion service shows an average of 4 to 11 playlist placements per campaign, depending on the tier, with real-time updates and written feedback from every curator decision. That feedback matters beyond the placement itself: a curator’s note on why a track worked or didn’t gives you a genre and tone signal you can use to refine your next pitch, rather than guessing blind. Watching your ratio in the weeks after a placement, alongside saves and skip rate, tells you whether that particular curator match is actually building repeat listeners or just passing through traffic.
The Ratio Is a Signal, Not the Whole Scoreboard
Stream to listener ratio tells you more about long-term audience quality than raw stream counts ever will, but treating it as the only number that matters is a mistake. Pair it with save rate and follower growth before drawing conclusions. Check it weekly during an active release push, then pull back to monthly checks once things stabilize. When the ratio climbs alongside saves and followers, that’s your cue to repeat whatever you just did.
— Einars
Build Repeat Listeners With Curator Placements That Actually Fit Your Sound
This service offers an alternative to blind playlist submissions and bot-driven services: every pitch goes to a real, genre-matched curator who reviews tracks and writes back with actual feedback, whether it’s a placement or a pass.
That transparency is the point. Campaigns average several playlist placements depending on the tier chosen, and with real-time updates on every decision, users can track which placements are impacting their stream to listener ratio and which ones are not. Pair that data with your save rate and follower growth, and you’ll know within a few 28-day windows whether a campaign built real fans or just a short-lived bump. Local, offline discovery tactics can reinforce that same repeat-listener effect, and artists building a following outside streaming platforms often see it show up in their Spotify numbers too.
If you’re ready to see which curators fit your genre, check out the Starter, Standard, Pro, and Max campaign tiers and start a submission today.
Sources
- What Is a Good Streams-Per-Listener Ratio on Spotify? | Artist Advisory Guides
- Spotify Metrics Explained: What’s the difference between listeners and streams?
- How to calculate engagement rate (Hootsuite)
- Artist Stats Explained — With Live Data | StreamClout
FAQ
What Is a Good Stream to Listener Ratio on Spotify?
A ratio between 2 and 3 over a 28-day window is considered healthy for most independent artists. Below 1.5 usually points to passive or playlist-driven reach, while above 4 often means a small, devoted audience or a deep catalog getting replayed.
Is 100,000 Streams on Spotify Good?
It depends entirely on your monthly listener count alongside it. 100,000 streams from 40,000 listeners (a 2.0 ratio) reflects a genuinely engaged audience, while the same 100,000 streams from 90,000 listeners suggests a playlist spike where most people only heard a track once.
What Is the Spotify 1,000 Rule?
There’s no official Spotify policy by that name. If you’re referring to a general goal of reaching your first several hundred engaged monthly listeners, the more useful marker isn’t the raw number, it’s whether your stream to listener ratio stays healthy as that audience grows.
How Many Streams Do You Need on Spotify to Make $10,000?
Per-stream payouts vary by market, subscription type, and label deal, so there’s no fixed stream count that guarantees a specific payout. Instead of chasing a target dollar figure, focus on your stream to listener ratio and save rate, since a smaller, more engaged audience tends to generate more sustainable long-term revenue than one built on passive playlist traffic.
How Does Intonality Help Improve My Ratio?
Intonality pitches your track to real, genre-matched curators and reports back with written feedback on every decision, averaging 4 to 11 placements per campaign depending on the tier. Because placements come from curators whose audience already fits your sound, listeners are more likely to stick around and boost your ratio rather than sample once and move on. Current pricing for each tier is available on the Intonality site.